Can COE prices be predicted?
If you're reading this, chances are the title caught your attention. And rest assured, we will be discussing how COE prices can be predicted. But first, we have to understand what exactly COE is.
What is COE?
The Certificate of Entitlement (COE), in simple words, is the right you pay for to drive your vehicle on Singapore roads (hence the words: "certificate" and "entitlement"). COEs are broken down into five classes, with each class catered to a specific type of vehicle. Each class has its own quota and award price. COEs are awarded every two weeks. An awarded COE last 10 years.
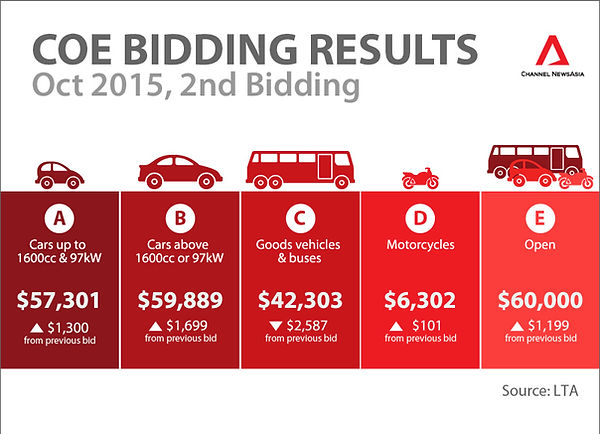
The five categories for COEs are A, B, C, D and E. Without going into too much detail: A and B are for passenger cars; C is for goods vehicles and buses; D is for motorcycles; and E is for any.
What affects COE prices?
There have been some changes to the distinction between Cat A and Cat B over the years, and this has had some impact in the prices. Changes in regulations such as the maximum loan amount allowed has also caused prices in COE to fluctuate. Market forces such as the global financial crisis in 2008, likewise, has also impacted the prices of COEs. Before we begin any prediction, let's look at how these external forces have affected the prices of COEs.
Despite the seemingly drunken walk that the prices follow, is there some inherent pattern that can be picked out? Can the accumulation of publicly-available data help us make sense of it all? For simplicity, we narrowed our focus to only CAT A COE prices.
1. Prices were generally beaten down before the end of the Global Financial Crisis
2. The imposition of financing restrictions by the Monetary Authority of Singapore brought prices down
3. The changes in CAT A classification achieved its goal in bringing prices down further by removing higher-end models from the CAT A class
The question that now emerges is: in order to accurately predict the prices, what factors do we need to consider? How can we effectively model as many external/market/macro factors as possible using only data that is public available? In simple terms: what affects COE prices?
How do we incorporate external factors using publicly-available data?
With this question in mind, data measuring various external forces from different sources were gathered. Some (but not all) of these factors included: the price of oil, the prime lending rate, the consumer price index and the number of bids available for that particular round. As this exercise was primarily a time-series analysis (analysing the change in a variable - Cat A Prices - over time) the previous price was also considered.
How was the prediction model built?
After playing around with the variables, only the significant ones were kept and fed into a regression model.
In layman terms, a regression model is basically drawing a line of best-fit through your data points, similar to what you did in secondary school. However, things get slightly more complicated as we begin dealing with more variables. The more variables we have, the more dimensions we have. In secondary school, we typically only worked with two variables and 2-dimensions on a sheet of paper (the x and y variable). For the purpose of visualisation, only the date and price variable have been plotted.
In statistical modelling, we also need a precise and scientific way of drawing this "line" (cannot just use eyes see and draw la). Furthermore, this "line of best-fit" that we are familiar with may not even be a straight line. This is when the beauty of mass data comes in. It allows the computer to see a trend and draw an extended "line of best-fit".
How is the prediction done?
What we are trying to do here is a simple case of machine learning. We give the machine a set of data (COE prices, CPI etc) and we tell it to make sense of it and pick out the trend. After mathematically picking out the trend, we tell it to extend this trend (extend the line of best fit) to an area where no data exists yet and make a prediction.
In our case, the computer/machine was fed data before 2012 and told to make prediction for prices after 2012. Since, in our case, we have the actual COE prices after 2012, we can compare it to the predicted ones to assess the accuracy of the predictions. So how did the prediction turn out?
The orange line is the the predicted COE prices the machine made - the accuracy can be verified with the blue points it overlaps. At a quick glance, we can see that the machine was able to pick up the trend in the prices to a large extent.
So how accurate is the prediction, really?
Upon observing and zooming in on the orange line (click and drag the graph), it can be seen that the predictor is somewhat slow when capturing a sudden spike or drop in prices. Overall, however, in predicting the accuracy of the CAT A COE prices after 2012, the prediction model did an impressive job of explaining 95.5% in the variation of the data (statistically: R Square value of 0.955).
How can I make use of this knowledge?
The model was only used to predict up to present-day prices, but of course, the orange line can be extended to the future bidding rounds. However, we see little point in doing so as we will have no data to verify its accuracy (we don't know future prices yet mah). Since we haven't shown any real future prediction, there is little you can act on just by reading this article (that was the point). However, in reality, even if you did have this predictor on-hand, it may be hard to make use of it if you are a buyer as it is typically the dealer that does the bidding.